

May 2024
Micro Cap Mid Q2 2024 Flash Report
Related Content
Our Strategies
Recent Blog Posts
Disclosure
Uniplan Investment Counsel, Inc. is a registered investment advisor. The views expressed contain certain forward-looking statements. Uniplan Investment Counsel believes these forward-looking statements to be reasonable, although they are forecasts and actual results may be meaningfully different. This material represents an assessment of the market at a particular time and is not a guarantee of future results. This information should not be relied upon by the reader as research or investment advice regarding any particular security. Past performance does not guarantee future results. Prices, quotes and other statistics have been obtained from sources we believe to be reliable, but Uniplan Investment Counsel cannot guarantee their accuracy or completeness. All expressions of opinion are subject to change without notice. It should not be assumed that recommendations made in the future will be profitable or will equal the performance of this security. Investment involves a risk of loss. A list of securities purchased and sold in the portfolio during the past year, including the purchase or sale price and the current market price, is available upon request by calling 262-534-3000.
Alternative Strategies
Alternative Thinking
About Uniplan
Get In Contact
Copyright © Uniplan Investment Counsel, Inc. All rights reserved. Privacy Policy.
Micro Cap Mid Q2 2024 Flash Report
Share
Uniplan Micro Cap Portfolio Flash Report – pdf click here
“Every virtue carried to the extreme, is a vice.”
~Aristotle
At our investment policy committee meeting in 1Q23, we summarized the relative valuation disparity between Micro Cap stocks and their larger S&P 500 brethren. Our conclusions were as follows:
Executive Summary:
These facts remain the same, although since then, as of the year ended March 31, 2024, micro cap performance as tracked by the IWC Micro Cap ETF has improved relative to the equal weighted S&P 500, possibly signaling the start of a reversal in relative performance for smaller company stocks.
S&P 500 vs. Equal Wt. S&P 500 vs. Mico Cap Stocks
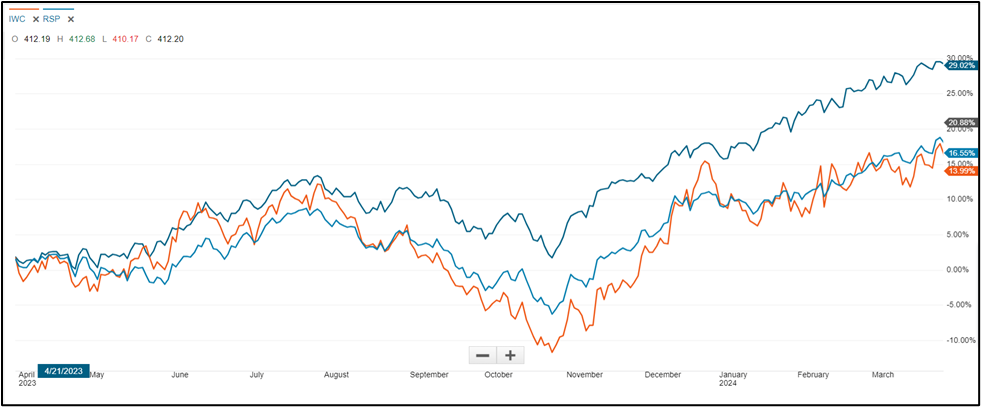
Source: Charles Schwab Marketplace
But both continue to lag the capitalization weighted S&P 500 where mega-cap tech stocks continue to drive outsized returns in the capitalization weighted benchmark with the top 10 S&P stocks reaching an all-time high weighting of 33.5%.
Source: FactSet
The Uniplan Micro Cap Portfolio underperformed slightly during Q1, as a number of names in the portfolio experienced high levels of volatility on both the up-side and down-side, and we acted to use that dispersion to rebalance across a number of holdings. See Portfolio Notes Section Below for more details.
Portfolio Notes
During Q1 we adjusted our positions at an average to slightly below average turnover rate, taking advantage of market strength to scale back some larger holdings and rotate the proceeds into several new opportunities while adding to other smaller positions in high conviction ideas. As the market continues to grapple with “Higher for Longer”, we continue to adjust the strategy with an emphasis on cash flow & strong balance sheets.
We sold two underperforming positions from the portfolio for failure to reach desired threshold events which led to material selling pressure on the stocks. We note the market’s increasingly harsh treatment of companies that fail to execute their business plans, which produces stocks that appear attractive on a valuation basis but often fail to reverse the negative trend in stock performance. More now than we can ever recall, it seems that exiting holdings that are struggling to execute early is the best course of action as stocks that go down, tend to keep going down as investors are unwilling to extend much patience in the current environment.
Two positions within the portfolio were trimmed for risk management purposes as the stocks had moved nicely higher and exceeded our desired target weights. In one case, Napco Security Technologies, Inc. (NSSC) was trimmed after strong price appreciation during the quarter up +17% following a positive earnings report, and a greater than 100% price return since its low point in October.
NSSC – Napco Security Technology
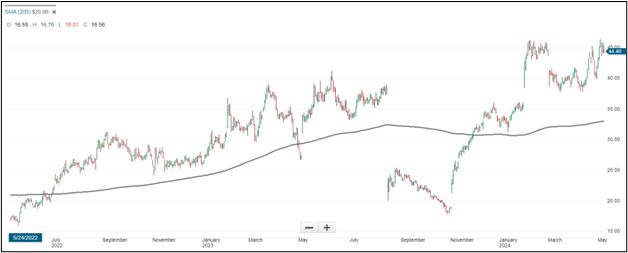
Source: Charles Schwab Marketplace
The other position, Uranium Energy Corp. (UEC), had gained +134% in the past 12 months as the outlook for uranium demand has continued to improve and U.S. strategic policy evolved to support the production of critical minerals within the country by domestic producers. Several other positions were scaled back as their market capitalizations start to approach small cap status due to positive long-term appreciation.
UEC – Uranium Energy Corporation
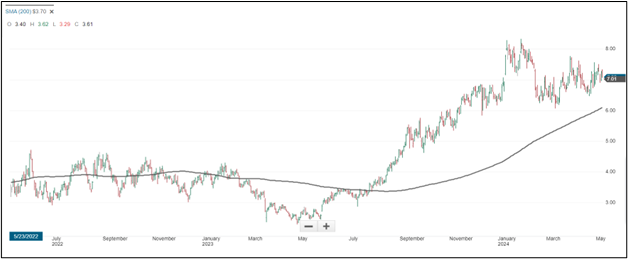
Source: Charles Schwab Marketplace
The proceeds from those sells and trims were invested across eight existing portfolio positions, each of which in our judgement represented compelling valuation metrics and increasing conviction. We are mindful in the current environment to carefully consider each company’s debt load, cash flow, and coverage metrics as interest expense remains elevated for many companies, particularly in the micro cap tranche of market capitalization.
Finally, we added five new names to the portfolio in small increments with the intention of building out larger positions over time on a case-by-case basis, with a focus on rewarding management teams that execute well and keeping a short leash on those that don’t. This approach to reducing initial investment helps protect against initial downside risk as we strengthen our conviction and build our position size gradually over time.
In the current environment where there are a multitude of factors influencing markets, from interest rate decisions to geopolitical conflicts to the backdrop of an election year in the U.S., we emphasize maintaining active, engaged dialogues with our portfolio companies. We are always thinking about and looking for ways to help create value by encouraging our management teams to pursue intelligent, value accretive capital allocation moves or making changes to upgrade governance, oversight, and business performance. In these times, our quiet and positive approach to engagement is more productive and appreciated, as we often act as a trusted sounding board for our company management partners.
Outlook & Analysis
An Environment of Extremes
It seems we live in a world of extremes – climate extremes, political extremes, wealth extremes, and arguably market extremes. At least when it comes to relative valuations between small and large companies, the extremes are currently approaching three-deviation tails. Mathematically, it’s simple to make mean reversion arguments. Absent a fundamental paradigm shift they tend to work. As such they are hypothesized, but attempting to time them is a difficult task. That said, an area of the market that continues to stretch to extremes and presents potential investing implications is the extreme valuation disparity between large versus small cap companies.
It could be argued that this in part is due to the numerous headwinds faced by small companies in the form of higher interest rates and lower earnings. That should be noted when considering the performance of micro cap stock benchmarks. It’s important because over 30% of micro cap companies have no current earnings and about 10% have no revenues. The performance of these unprofitable growth stocks in recent years has been highly sensitive to the path of inflation and interest rates as we have noted in prior Flash Reports. This is primarily due to the long duration profile of unprofitable growth stocks and the need to fund operations by issuing dilutive equity or raising debt at current elevated interest rates. See our prior analysis here: (https://uniplanic.com/micro-cap-flash-2020-q3/). It is worthy to note that the companies in the Uniplan Micro Cap Portfolio have revenues, earnings, positive cash flow and modest levels of debt, if any. They are high quality small companies.
According to Goldman Sachs Research, as of April 29, 2024, the typical stock that analysts expect to become profitable this year or next year has fallen by 4% YTD, firms expected to become profitable in 2026 have declined by 15%, and stocks forecast to turn profitable after 2026 have dropped by 28%. In addition, unprofitable growth stock EV/Sales multiples have compressed from 14x in 2021 to 4x today. When small stock benchmarks are adjusted for these unprofitable companies, the valuation disparity between large and small companies, when measured by the equity risk premium, has reached an all-time high.
The equity risk premium is the difference between the S&P 500’s earnings yield and that of the 10-year Treasury’s. It currently (5/10/2024) stands at about 17 basis points, (4.62% Forward Earnings Yield minus 4.45% current 10-year Treasury Yield) a low not seen since 2000. That is well below the average spread of around 3.5% since 2008, and the long-term average spread since 1928 of 4.4%.
The same risk premia for micro cap stocks with earnings are currently 3.09% (7.54% earnings yield minus 4.45% current 10-year Treasury Yield), a full 2.92% over the S&P 500 risk premia. Looking back historically, small and micro cap stocks normally trade at a risk premia that is lower than large cap stocks because they are inherently riskier (have more volatility) than bigger companies. So, on a relative value basis small companies look cheap.
Source: FactSet
As can be seen in the graph above, historically small companies traded at higher p/e multiples than large companies. That relationship changed in late 2021, we wrote about it in 2023, anticipating a reversal, yet the valuation discount has persisted into 2024.
The extremes continue to other areas of valuation. The following are a few that stand out as stretched in the analysis:
Source: FactSet
Source: FactSet
Finally, a look at a valuation indicator that we deem to be an important reflection of opportunity at the company level, is that of free cash flow yield (FCF). Historically, FCF yields have been slightly higher for small companies but in general have tracked those of large companies. And, going back to the notion of equity risk premium, one would expect that, given the added risks in equity investments, the FCF yield of stocks would in general be at a premium to the risk-free rate and the 10-year government bond. In the case of small companies this is true, but large companies now trade at a FCF discount to the risk-free rate. Yet another visible extreme.
Source: FactSet
Insider Activity
As our investors know, we also closely monitor insider and smart money activity across our portfolio and the micro-cap universe. Insiders at many of our portfolio companies have continued to personally buy shares in the open market this quarter, while the broader insider buying ratio moved into positive territory last week after spending most of the first quarter in the neutral or negative range. This indicates executives signaling confidence in their companies and the future of the business. This is generally a positive signal about current valuations and future earnings outlook.
It’s worth noting that insider and smart money buying among small and micro cap companies have been fairly level during Q1 and consistent with long term averages. The bearish reading was driven largely by extremely high levels of selling among large cap tech companies where executives sold large amounts of stock at a much higher rate than had been seen in 2022 and 2023. This could suggest that some large company executives feel their stock might reflect fulsome valuations relative to long term averages.
Summary & Conclusion
Over the years, we have argued that investing in micro-cap stocks can offer excess returns because of the inefficient information flow regarding the thousands of small companies which populate the space. Do your homework, be mindful of valuation and actively manage risk; that is the path to adding alpha in a micro-cap portfolio. This thesis is supported in part by the fact that very few micro-cap companies have any formal sell side research analyst coverage. As a result, doing primary source research can often lead to gaining insights and finding opportunities long before the broader investing public discovers these facts.
While some investors may try to gain micro cap exposure via the index or ETF in an effort to time and capture market beta, we would argue that this is a less effective way to play small and micro-cap opportunities. In the current market environment, there seem to be bigger differences between winners and losers on an individual security basis. In a market segment where careful fundamental research can still result in an information advantage, our rigorously screened bottom-up work on business, management, and valuation along with our thematic macro framework helps us distinguish real businesses trading at attractive relative valuations.
Given the extreme current valuation disparities between small and large companies, we are excited for the long-term prospects of our portfolio and continue to find interesting opportunities with high quality small companies offering compelling values. As outlined above, valuations in the small and micro cap space look more attractive than they have in a decade. We believe that for the patient long-term investor, micro-cap stocks offer better return opportunities than any domestic equity class. For these reasons we believe now more than ever, micro-cap stocks have a meaningful place in the portfolios of individual investors.
May 2024
Richard Imperiale
Chief Investment Officer
Mitchell Beine
Senior Investment Analyst
The views in this letter were as of May 2024 and may not necessarily reflect the same views on the date this letter is first published or any time thereafter. These views are intended to help viewers to understand the strategy’s methodology and do not constitute investment advice or recommendations.
Investors should understand that micro cap stocks are subject to a higher degree of risk than other equity investments due to the small size of the companies and the limited trading volume inherent in micro cap stocks.
All investments carry a certain degree of risk, including possible loss of principal. Past performance does not guarantee future results. REITs are subject to illiquidity, credit and interest rate risks, as well as risks associated with small and mid-cap investments. It is important to review your investment objectives, risk tolerance and liquidity needs before choosing an investment style. Value style investing presents the risk that the holdings or securities may never reach their full market value because the market fails to recognize what the portfolio management team considers the true business value or because the portfolio management team has misjudged those values. In addition, value style investing may fall out of favor and underperform growth or other style investing during given periods.
Uniplan Investment Counsel is a registered investment advisor. The views expressed contain certain forward-looking statements which can be speculative in nature. Uniplan Investment Counsel believes these forward-looking statements to be reasonable, although they are forecasts and actual results may be meaningfully different. This material represents an assessment of the market at a particular time and is not a guarantee of future results. This information should not be relied upon by the reader as research or investment advice regarding any particular security and is subject to change without notice. Prices, quotes and other statistics have been obtained from sources we believe to be reliable, but Uniplan Investment Counsel cannot guarantee their accuracy or completeness. All expressions of opinion are subject to change without notice. It should not be assumed that recommendations made in the future will be profitable or will equal the performance of this security. This information is not an offer to buy or sell a security nor does it constitute investment advice or an offer to provide investment advisory or other services. All information is subject to correction or change. A list of securities purchased and sold in the portfolio during the past year, including the purchase or sale price and the current market price, is available upon request by calling 262-534-3000.
Share